2025 U.S. Core PCE Inflation 2.9% and Trade Deficit Surge: What’s Next for the Economy?
July 2025 data shows U.S. core PCE inflation at 2.9% and the trade deficit surging 22% to $103.6B. This analysis explains what it means for the Fed and growth.
Key Takeaways
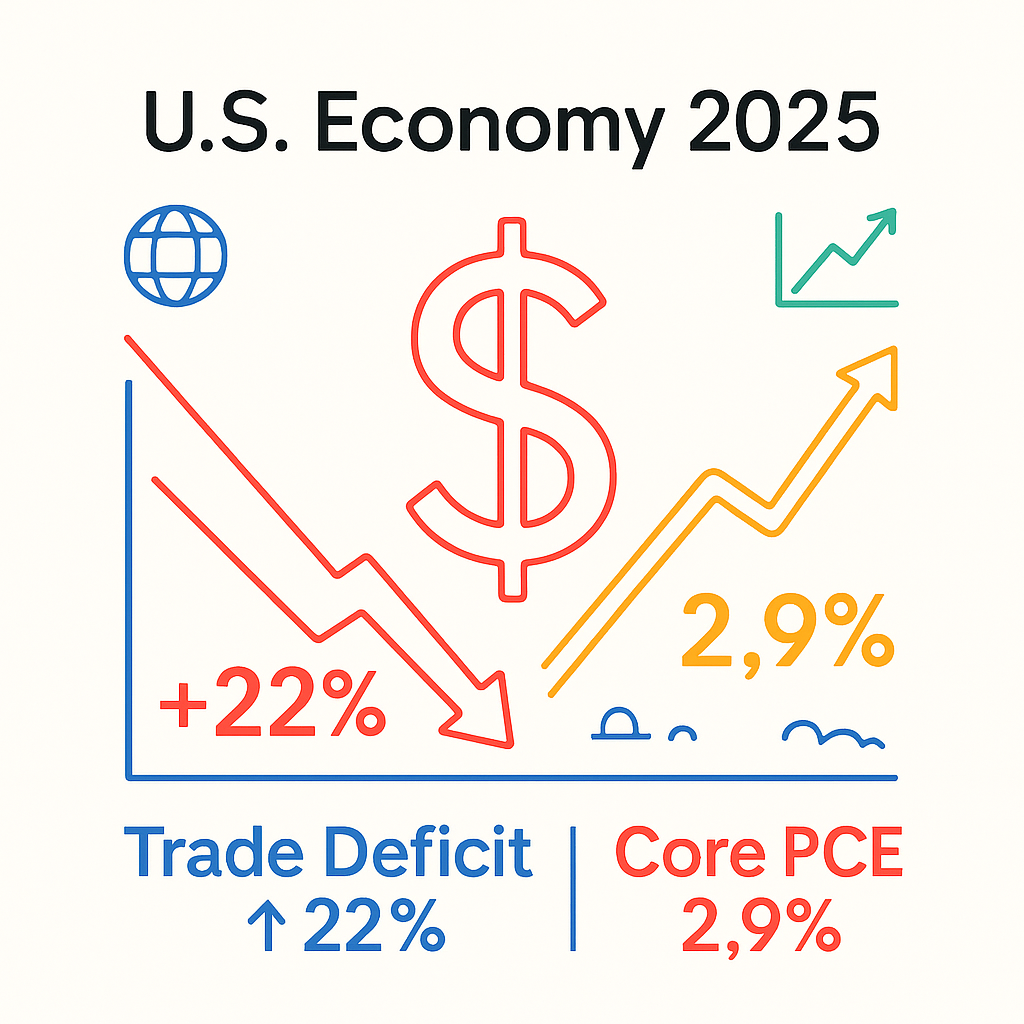
✔ U.S. trade deficit widened 22% in July 2025 to $103.6B
✔ Core PCE inflation climbed to 2.9%, above the Fed’s 2% target
✔ Strong spending with inflation and deficits complicates Fed’s next moves
The 2025 U.S. core PCE inflation 2.9% trade deficit surge analysis highlights how July’s economic data sent mixed signals.
The trade deficit jumped 22.1% in one month, reaching $103.6 billion, while core PCE inflation rose to 2.9%, up from 2.8% in June. Consumer spending grew 0.5%, showing resilience, but rising inflation and a larger deficit add new risks.
This combination matters not only for investors but also for policymakers, as it shapes the debate on whether the Fed should cut rates in September.
Why July 2025 Trade Deficit and Core PCE Inflation Matter
July’s numbers mark a turning point. The sharp trade deficit surge shows U.S. imports expanding faster than exports. At the same time, core PCE inflation at 2.9% confirms price pressures remain sticky.
Together, these trends create a double burden: weaker external balance and stubborn inflation.
Data Snapshot: 2025 U.S. Core PCE Inflation 2.9% Trade Deficit Surge
|
Indicator |
June 2025 |
July 2025 |
|---|---|---|
|
Core PCE (YoY) |
2.8% |
2.9% (higher) |
|
Consumer Spending |
+0.4% |
+0.5% (stronger) |
|
Trade Deficit |
~$85B |
$103.6B (+22%) |
|
Fed Outlook |
Cuts priced in |
Still expected despite risks |
This table confirms that July brought not just one but two stress points—inflation and trade.
Expert Commentary on Inflation and Trade Risks
Economists warn the July 2025 numbers could foreshadow stagflation.
- Preston Caldwell, Morningstar: “The U.S. economy is showing stagflationary tendencies—slower growth with sticky inflation. If jobs weaken, the Fed may still deliver two cuts.”
- Terry Lane, Investopedia: “The core PCE inflation rate at 2.9% is above target but doesn’t rule out cuts. Labor market weakness would tilt policy toward easing.”
These expert takes underscore why the 2025 U.S. core PCE inflation 2.9% trade deficit surge analysis matters: it signals a fragile balance between growth and inflation.
How Core PCE Inflation at 2.9% Challenges the Fed
The Fed’s 2% inflation goal is being tested. July’s core PCE inflation at 2.9% suggests that easing policy too soon risks reigniting inflation.
Yet delaying cuts risks slowing growth further, especially with a widening trade deficit. This tension explains why markets are uncertain about the September FOMC.
Why the Trade Deficit Surge Is a GDP Headwind
The July 2025 trade deficit surge directly drags on GDP.
Higher imports reduce domestic demand for U.S.-made goods, pressuring industries like manufacturing and autos. Tariffs could further raise consumer prices, adding to inflation.
This is why the 2025 U.S. core PCE inflation 2.9% trade deficit surge analysis is not just academic—it highlights risks that directly affect households and businesses.
What to Watch: Jobs Report and September Fed Meeting
Two events will decide whether July’s numbers shift Fed policy:
- August Jobs Report – Weak hiring would strengthen the case for rate cuts despite inflation.
- September FOMC – Markets currently see an 87% chance of a cut, but sticky inflation could force a slower pace.
Trade flows and tariffs will also remain critical variables. If the trade deficit surge continues while core PCE inflation stays near 3%, the Fed’s path will be even more complicated.
July 2025 showed a complex mix: a 22% trade deficit surge, core PCE inflation at 2.9%, and resilient consumer spending.
The Fed faces tough choices. Inflation hasn’t cooled enough, but delaying cuts risks a sharper slowdown. The next jobs report and September FOMC will be decisive.
References
- Reuters: US reports solid July consumer spending; core inflation firmer
- Investors.com: PCE Inflation Data Passes First Test Of Fed Rate-Cut Shift
- The Guardian: US trade deficit surges – live updates
- The Times: Rise in US inflation complicates debate over rate cuts
- Investopedia: What July’s PCE Inflation Report Means for the Fed