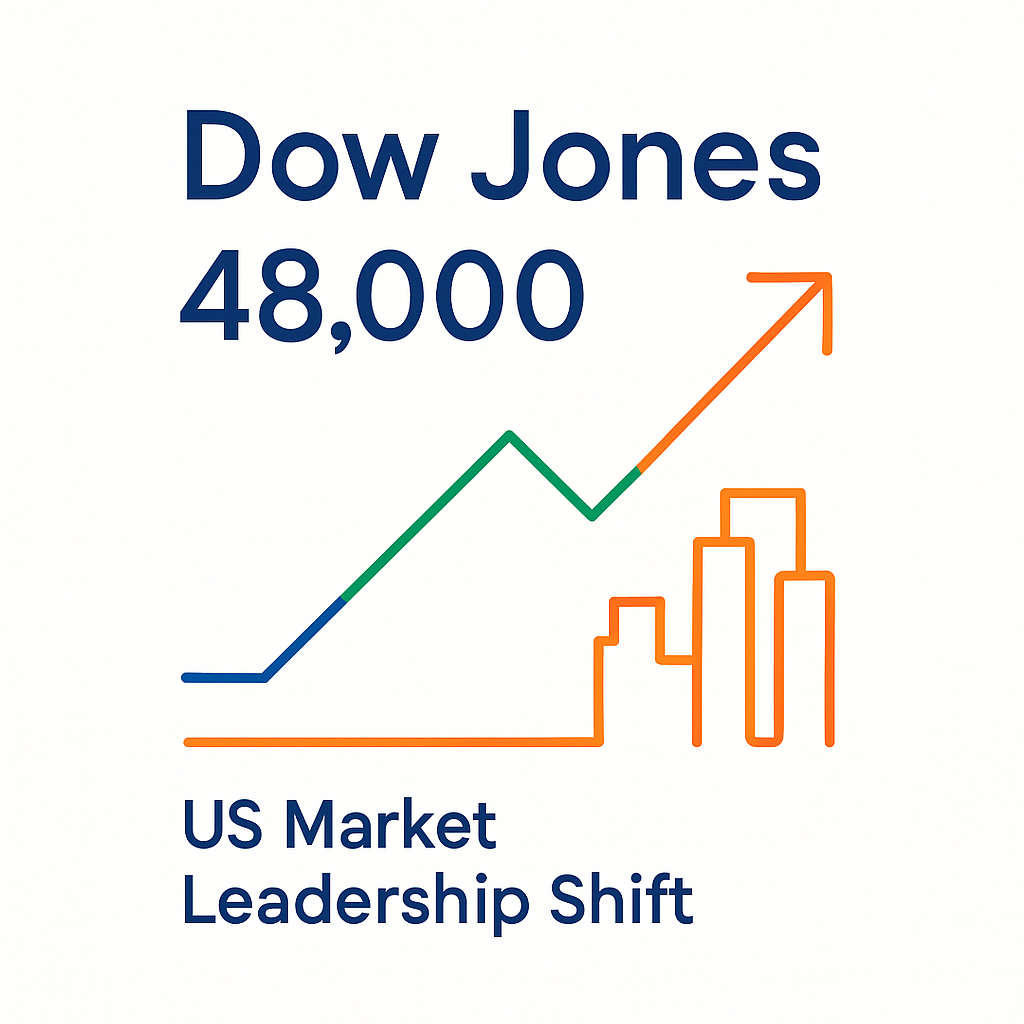
Dow Jones Breaks 48,000: What the New Market Leadership Means for Investors
The Dow Jones breaks 48,000 as sector leadership shifts from tech to financials and industrials. Explore what this means for investors and market trends in 2025.
Key Takeaways
✔ The Dow Jones Industrial Average surpassed 48,000, signaling a shift in market leadership.
✔ Financials, industrials, and health care are driving gains while some tech names lag.
✔ Higher rates and rising capital expenditures are pressuring long-duration growth stocks.
✔ Sector rotation reflects deeper macro trends rather than a short-term anomaly.
✔ The next move toward 50,000 depends on rates, federal spending, and global risks.
The Dow Jones Industrial Average crossing 48,000 marks a significant turning point for U.S. markets. Unlike earlier rallies dominated by mega-cap tech, this milestone reflects a broader rotation into financials, industrials, and other traditional sectors. This shift suggests that investors are reassessing where reliable earnings and cash flow will come from in a high-rate environment. As capital flows change direction, the structure of market leadership is evolving—and understanding this evolution is essential for investors in 2025.
From 40,000 to 48,000: What Powered the Dow Jones Over the Past 18 Months
The Dow first broke above 40,000 in May 2024, supported by cooling inflation and optimism around the Federal Reserve’s policy path. Over the next year and a half, the index climbed steadily through periods of shifting macro data, changes in interest-rate expectations, and renewed fiscal concerns.
Early 2025 saw industrial and materials companies outperform as U.S. manufacturing indicators stabilized. Later in the year, reduced anxiety over a federal government shutdown boosted confidence in banks and other cyclical names. Even when tech stocks experienced sharp pullbacks, the Dow remained resilient, continuing its steady upward trend. This consistent performance ultimately carried it across the 48,000 threshold, signaling a broader shift in market dynamics.
Dow vs. S&P 500 vs. Nasdaq: Which Index Shows the Market’s Real Direction?
Each major U.S. index highlights different aspects of market sentiment. Understanding these distinctions is essential when interpreting the Dow’s breakout.
- Nasdaq 100: Weighted toward AI, cloud, and semiconductor giants. It reflects long-term innovation themes and performs best when investors favor high-growth stories.
- S&P 500: Broad coverage of 500 companies across all sectors. It represents the overall health of U.S. corporate earnings and economic conditions.
- Dow Jones: Concentrated in financials, health care, and industrials. It captures shifts toward stability, cash flow, and traditional economic strength.
The Dow leading the latest rally indicates that investors are diversifying away from purely tech-driven momentum. Rather than relying on AI-related growth alone, the market is rewarding companies with durable earnings and more balanced risk profiles.
Why High Rates Push Money Toward Financials and Industrials Instead of Growth Stocks
Interest rates have become the defining force behind the current market shift. Growth stocks are particularly sensitive to high yields because their valuations depend heavily on future earnings discounted at current rates. When rates stay elevated, these future earnings lose value.
Financials, however, benefit from a high-rate environment through stronger net interest margins. Industrial companies gain from ongoing manufacturing reshoring, supply-chain upgrades, and increased capital spending. Many of these firms can convert new demand into immediate revenue, offering clearer earnings visibility.
Meanwhile, the AI boom—despite its transformative potential—requires massive infrastructure investments. Data centers, advanced chips, and energy capacity all require large upfront spending. This delays profitability, making some tech firms less appealing in the current macro environment. As a result, capital is flowing into sectors with more immediate cash returns.
U.S. Sector Rotation in 2025: Which Industries Are Attracting Real Capital Flows?
The 2025 sector rotation reflects structural changes rather than a simple cyclical swing.
Financials are benefiting from solid loan demand and favorable interest margins.
Industrials and infrastructure-related companies gain from federal incentives, corporate equipment upgrades, and stronger onshoring trends.
Health care and consumer staples attract investors seeking defensive exposure with stable revenue streams.
These flows reflect an investor preference for dependable earnings and lower valuation risk. In contrast, certain high-valuation tech names experience sharp corrections when earnings or guidance miss expectations. This divergence underscores the new market reality: reliable cash flow currently outweighs distant growth promises.
Can the Dow Jones Reach 50,000? Three Variables That Will Shape the Next Move
The Dow’s path from 48,000 to 50,000 will be shaped by three major variables:
The Federal Reserve’s Rate Trajectory
If inflation continues to ease and the Fed begins gradual rate cuts, conditions will become more supportive for both traditional and growth sectors. If inflation reaccelerates, higher long-term yields may slow the Dow’s momentum.
Federal Budget Stability and Shutdown Risk
Disruptions around budget negotiations could affect market volatility. Infrastructure and industrial stocks—key components of the Dow—are particularly sensitive to changes in government spending.
Global Growth and Geopolitical Tensions
Slower activity in China, political uncertainty in Europe, and conflict-driven disruptions can influence risk appetite. Defensive sectors inside the Dow may outperform if global risks intensify.
Overall, the index still has room to climb, but the pace of the rally will largely depend on how these macro forces evolve through 2025.
The Dow Jones crossing 48,000 marks more than a new record—it reveals a dramatic shift in how investors are allocating capital in 2025. Market leadership is expanding beyond mega-cap tech toward financials, industrials, and other traditional sectors with more stable earnings and cash flow.
References
- Wall Street Journal – Dow Jones Market Coverage
- Reuters – U.S. Stock Market and Fed Policy Updates
- Bloomberg Markets – U.S. Equities & Macro Analysis
- CNBC – Dow Jones Industrial Average & Sector Performance
- S&P Dow Jones Indices – Index Methodology & Data
- Federal Reserve – Monetary Policy & Rate Decisions
- U.S. Bureau of Economic Analysis (BEA) – GDP, Income & Spending Data
- U.S. Bureau of Labor Statistics (BLS) – CPI & Employment Data
- Morgan Stanley Research – Equity Outlook & Sector Rotation
- Goldman Sachs Global Investment Research