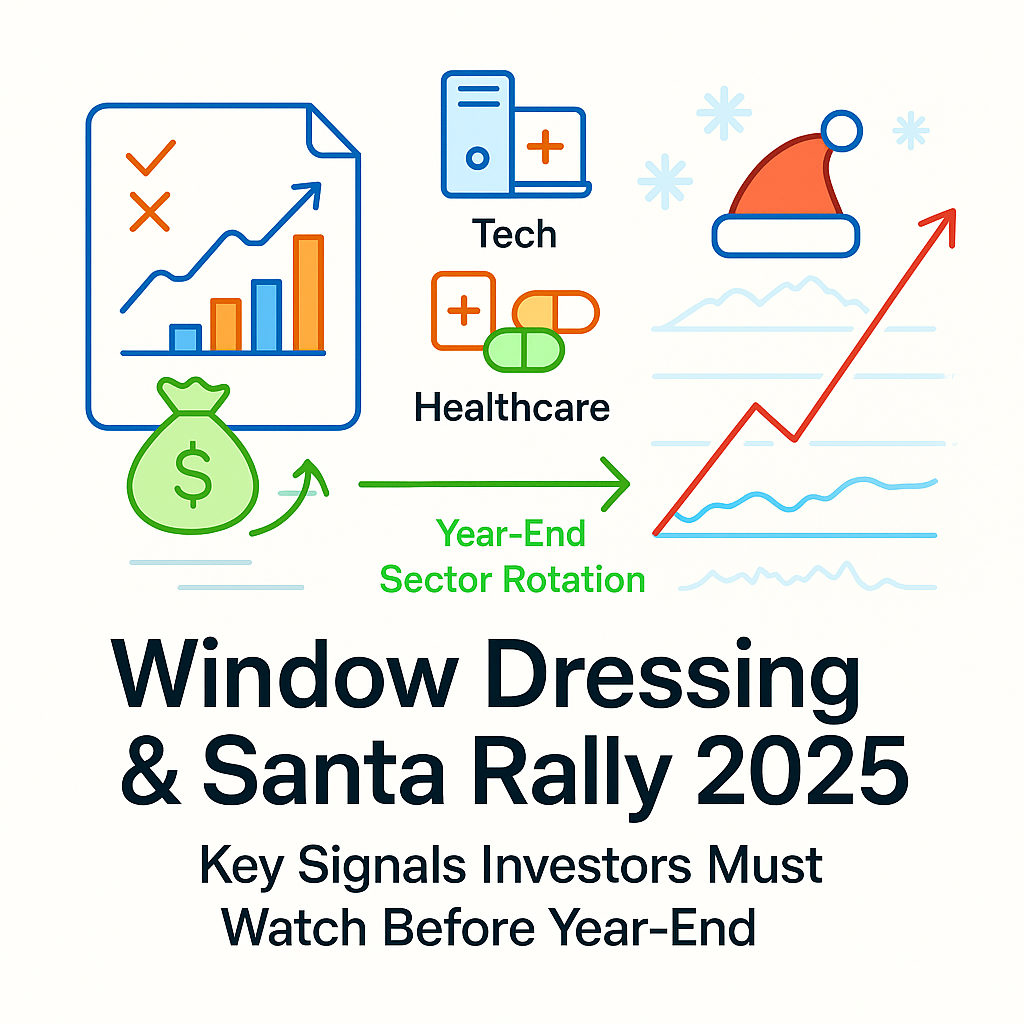
Will Window Dressing Start in Late November? Key Sectors to Watch Before the Santa Claus Rally
A clear guide to late-November window dressing, the Santa Claus rally outlook, and the defensive sectors investors should watch before year-end.
Key Takeaways
✔ Window dressing often intensifies in late November as institutional investors adjust portfolios to improve year-end performance.
✔ Tech, utilities, and communication services were the strongest sectors this year, while healthcare and defensive sectors gained momentum in November.
✔ Individual investors may benefit from focusing on dividend stocks and defensive sectors instead of chasing high-valuation megacaps.
✔ U.S. investors should monitor tax-loss harvesting rules, including wash-sale restrictions.
✔ The Santa Claus rally has a strong historical pattern but isn’t guaranteed each year.
Late November is one of the most important periods for U.S. equity markets. Two major forces often collide: window dressing by institutional investors and the potential for a Santa Claus rally in late December.
Window dressing can reshape short-term sector flows, while the Santa Claus rally—historically producing about a 1.3% gain during the final 5 trading days of December and the first 2 of January—drives seasonal optimism.
For individual investors, understanding how year-end portfolio rotation and defensive-sector flows interact is essential. The goal is not to time every move but to recognize where institutional money tends to shift as the calendar resets.
Why Window Dressing Accelerates in Late November: How Institutional Performance Shaping Works
Window dressing is the practice of adjusting portfolios near quarter- or year-end to make holdings look stronger on performance reports. Fund managers often add this year’s winners while trimming laggards to enhance perceived credibility.
Several studies show that funds with heavier window-dressing behavior tend to have higher turnover, weaker long-term performance, and greater sensitivity to short-term momentum. This behavior can create temporary distortions in sector flows, usually visible in the final weeks of November and early December.
For individual investors, this period often brings sharper-than-usual moves in popular stocks, not because fundamentals changed but because institutions are reshaping their year-end narrative.
Which Sectors Dominated 2025: From Tech Outperformance to Healthcare Leadership in November
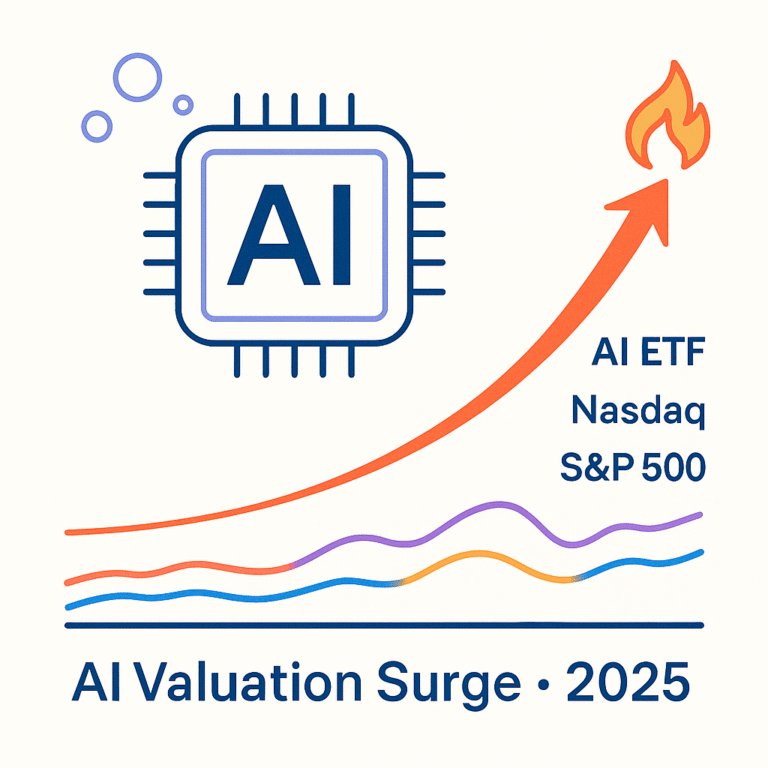
The strongest sectors in 2025 have been:
- Technology — powered by AI, cloud, and semiconductor strength
- Utilities — supported by steady dividends and interest-rate stability
- Communication Services — boosted by digital advertising and subscription growth
However, November marked a notable shift. Tech experienced a mild pullback, while healthcare, utilities, and other defensive sectors took the lead. Healthcare, in particular, benefited from strong demand in weight-loss drugs and large-cap pharma resilience.
This shift reflects a broader pattern: institutions reducing risk into year-end while locking in gains from earlier outperformers.
What Actually Happens Inside Year-End Portfolios: Blending Winners With Defensive Hedges
Institutional year-end rotation typically follows two parallel tracks.
First, funds increase exposure to the year’s strongest performers—technology, platforms, and select utilities—so the final portfolio snapshot looks aligned with the market’s winning themes.
Second, funds rebalance toward defensive sectors such as healthcare, utilities, and consumer staples. These sectors offer stable cash flow and lower volatility heading into the quieter holiday trading period.
The result is an unusual mix of inflows:
- “Performance alignment” flows into winners
- “Risk-reduction” flows into defensive assets
This two-way rotation can create short bursts of volatility and mispricing—opportunities for long-term investors who know where to look.
How Individual Investors Should Respond: Favor Defensive and Dividend Sectors Over High-Beta Chasing
Megacap tech stocks have carried the market, but high valuations and year-end rebalancing make aggressive chasing less attractive. Instead, investors may benefit from focusing on:
- Dividend stocks and income-focused ETFs
- Healthcare and utilities for defensive stability
- Communication services for balanced growth + cash flow
The goal is not to avoid growth but to position portfolios so they can withstand late-year volatility, tax-driven selling, and reduced liquidity during the holiday period.
For many investors, year-end is a good time to rebalance—not by exiting winners, but by strengthening defensive anchors.
Year-End Tax Forces: How Tax-Loss Harvesting and Wash-Sale Rules Distort Prices
Tax-loss harvesting accelerates sharply in December as U.S. investors sell losing positions to offset capital gains. Losses can offset gains fully and can reduce up to $3,000 of ordinary income each year.
However, the wash-sale rule prevents investors from repurchasing the same or “substantially identical” security within 30 days before or after selling. This restriction creates temporary demand for substitute ETFs and increases selling pressure on specific losing names.
For investors outside the U.S., these flows still matter.
Tax-driven selling in the U.S. can spill into global ETFs and ADRs, producing attractive entry opportunities that have nothing to do with a stock’s long-term fundamentals.
When Does the Santa Claus Rally Happen? Key Conditions for a Seasonal Upswing
The Santa Claus rally refers to the final 5 trading days of December plus the first 2 trading days of January. Historically:
- Average gain: ~1.3%
- Positive return frequency: ~76–79%
But this pattern weakens in years with elevated macro risk, poor liquidity, or aggressive tax-loss selling. Recent years have shown that the rally is no longer automatic.
Investors should watch several indicators:
- Liquidity trends in mid-December
- Institutional rebalancing data
- Market sentiment and volatility levels
- Expectations for January fund inflows
The rally is not guaranteed, but when conditions line up, it often signals a constructive start to the new year.
A Three-Step Checklist for Investors Navigating Window Dressing + the Santa Claus Rally
1. Late November to Early December
Track shifts in sector leadership, especially tech trimming and defensive-sector inflows.
2. Mid-December
Watch for declining trading volume. Reduced liquidity can cause sharp but temporary price swings.
3. Late December to Early January
Evaluate whether a Santa Claus rally forms.
If it does, January often starts with positive momentum.
If it does not, volatility in Q1 tends to increase historically.
This structured approach helps keep decisions grounded, not reactive.
Late November through early January is a uniquely complex period. Window dressing, tax-loss harvesting, and seasonal momentum all intersect, creating both risks and opportunities.
Instead of chasing high-beta stocks at year-end, investors may benefit from reinforcing defensive and dividend exposure while observing institutional rotation patterns.
Review your holdings now.
Identify what should remain into the new year—and what should be rebalanced before volatility picks up.
References
- Window dressing in mutual fund portfolios: fact or fiction?
- Assessment of window dressing using fund returns and portfolio holdings: The Spanish Review of Financial Economics.
- Santa Claus Rally: What It Is and Means for Investors – Investopedia
- Santa Rally: What Is & Can It Happen in 2025? – Plus500